Orientation
CommonGage is a system of record for engagement work: what your organization did, where the gaps are, and what it cost — across every site, on one screen. It replaces three things that usually live in separate spreadsheets:
- Obligation tracking — which sites have met each of your organization's requirements
- Engagement activity — events logged across every site, organized by hub and zone
- Capacity outcomes — how events map to the Dual Capacity-Building Framework (Mapp, 2019)
This walkthrough gets you from your first sign-in to pulling an end-of-year report. Read it top to bottom once, then come back to any section as a reference.
Know the screen
Here's what things are called. The rest of this guide references these names.
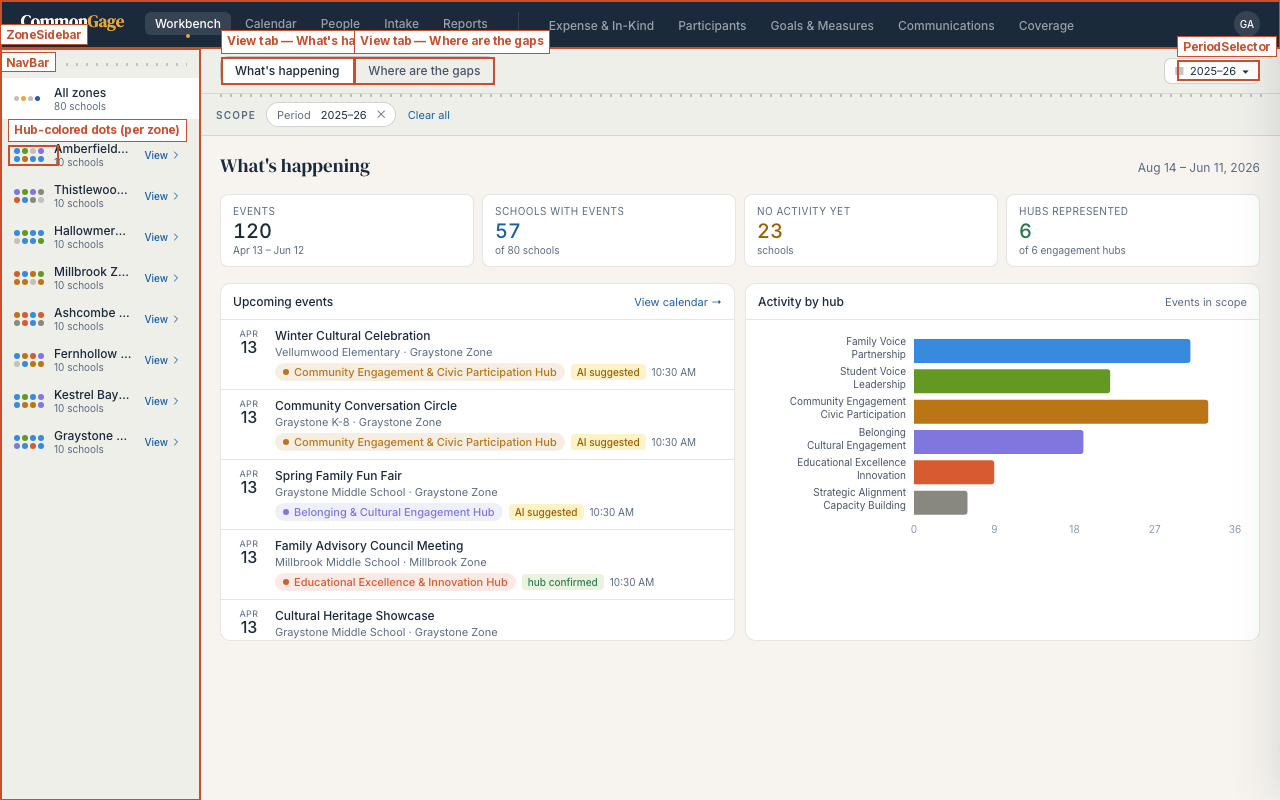
| NavBar | The dark bar across the top. Core screens sit on the left (Workbench, Calendar, People, Intake, Reports, Find); a vertical divider separates them from your organization's licensed modules on the right. |
| ZoneSidebar | The left panel on the Workbench. One row per zone, each with a small cluster of dots — one dot per school. |
| View Tabs | "What's happening" and "Where are the gaps" — the Workbench's two lenses on the same underlying record. |
| PeriodSelector | The "2025–26 ▾" control, top right of most screens. Everything on screen is scoped to whatever reporting period is selected here. |
| ScopeBar | The row of removable filter chips just under the toolbar — Period, Zone, and anything else currently narrowing the view. |
| AvatarMenu | Your initials, top right. Settings, My Flags, and (if you're an admin) Manage Users all live here. |
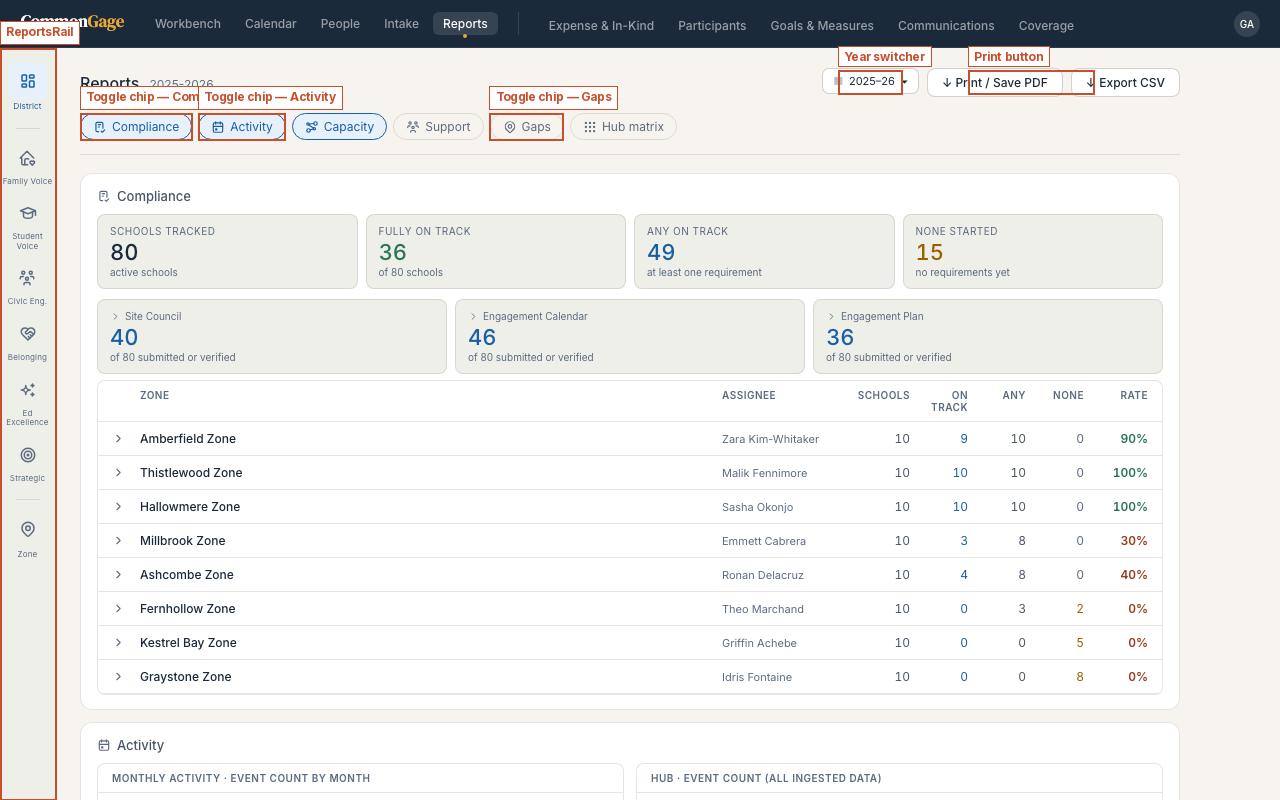
One more landmark worth naming here: the toggle chips along the top of the District View (Compliance, Activity, Capacity, Support, Gaps, Hub matrix) — each turns a block of the report on or off. Pulling the Report covers these in depth.
Navigation
The top bar has six core links, available to every organization regardless of which modules are licensed:
| Link | What it's for |
|---|---|
| Workbench | At-a-glance summary of activity across the organization |
| Calendar | Browse and manage individual events by school |
| People | Staff and person records — what you can edit depends on your role |
| Intake | Where calendar events come from — iCal feeds, spreadsheets, or document uploads, configured per school or zone |
| Reports | Deep-dive analytics and exports |
| Find | Ask a question in your own words and get back the matching records themselves |
If your organization has licensed modules — Expense & In-Kind, Participants, Goals & Measures, Communications, Coverage, Partnerships, Projects, or Proof — they appear after a divider on the right side of the same bar. The Modules covers each one.
Click your avatar (top right) for Settings, My Flags (a personal inbox of data-quality flags raised on records you touch), and — if you're an Org Admin — Manage Users.
Who sees what
What you see depends on your role and scope:
| Role | Sees |
|---|---|
| Org Admin | Everything across the organization |
| Zone Coordinator | Their home zone, plus any zones or schools they've been individually granted |
| Building Staff | Their home school, plus anything they've been individually granted |
Your organization may display different names for these roles, or for "zone" and "school" — the concepts are the same even if the labels differ.