Pulling the Report: the Payoff
If you've been doing the daily/weekly and monthly/quarterly habits all year, this section is trivial. The report builds itself from the record.
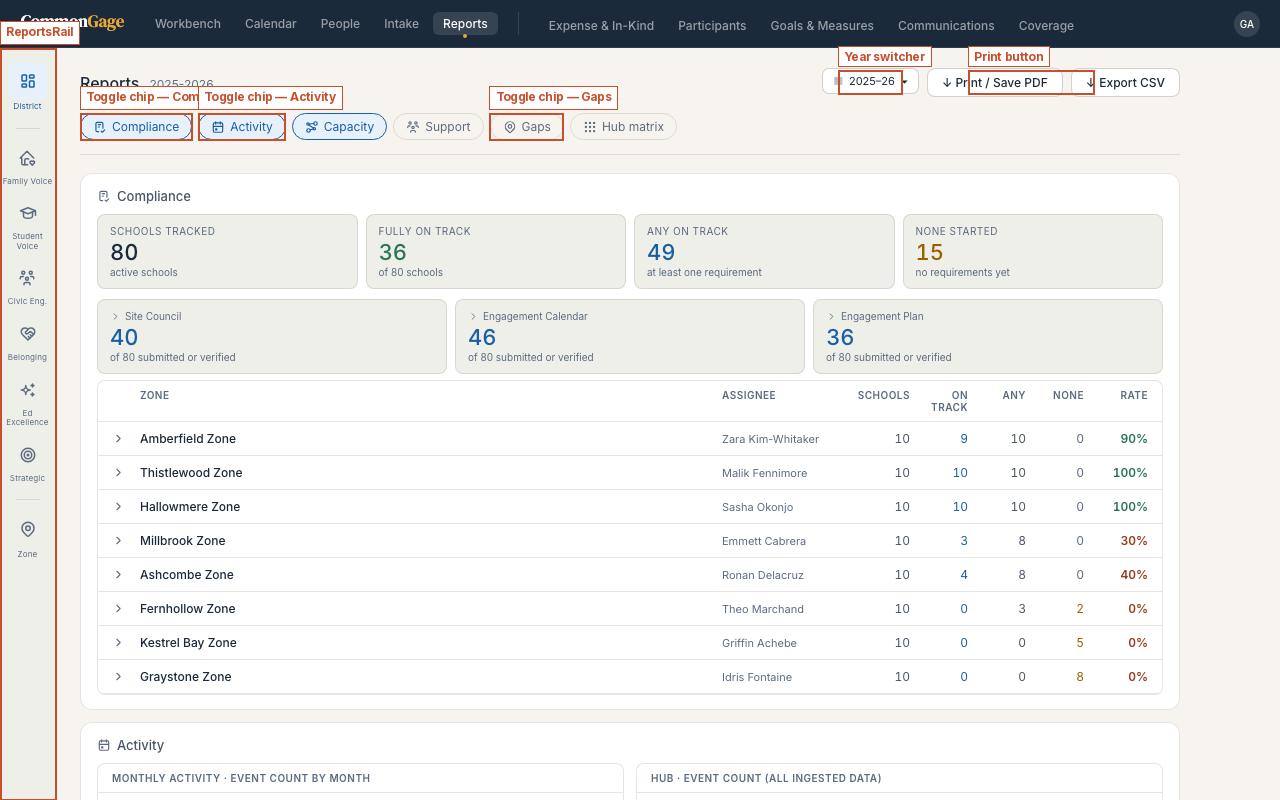
The Reports screen has a 56px icon rail on the left edge, with three tiers:
[ District ]  ← composable analytics canvas
─────────────
[ Hub 1     ]  ← your organization's hubs, in the order it defines them
[ Hub 2     ]
[ Hub 3     ]
...
─────────────
[ Zone      ]  ← geographic cut
Click any icon to switch views. The active lens is highlighted. Hub names, colors, and order are set per organization — the ones above are just an example.
District View — the composable canvas
- Go to Reports. The District icon at the top of the rail is selected by default.
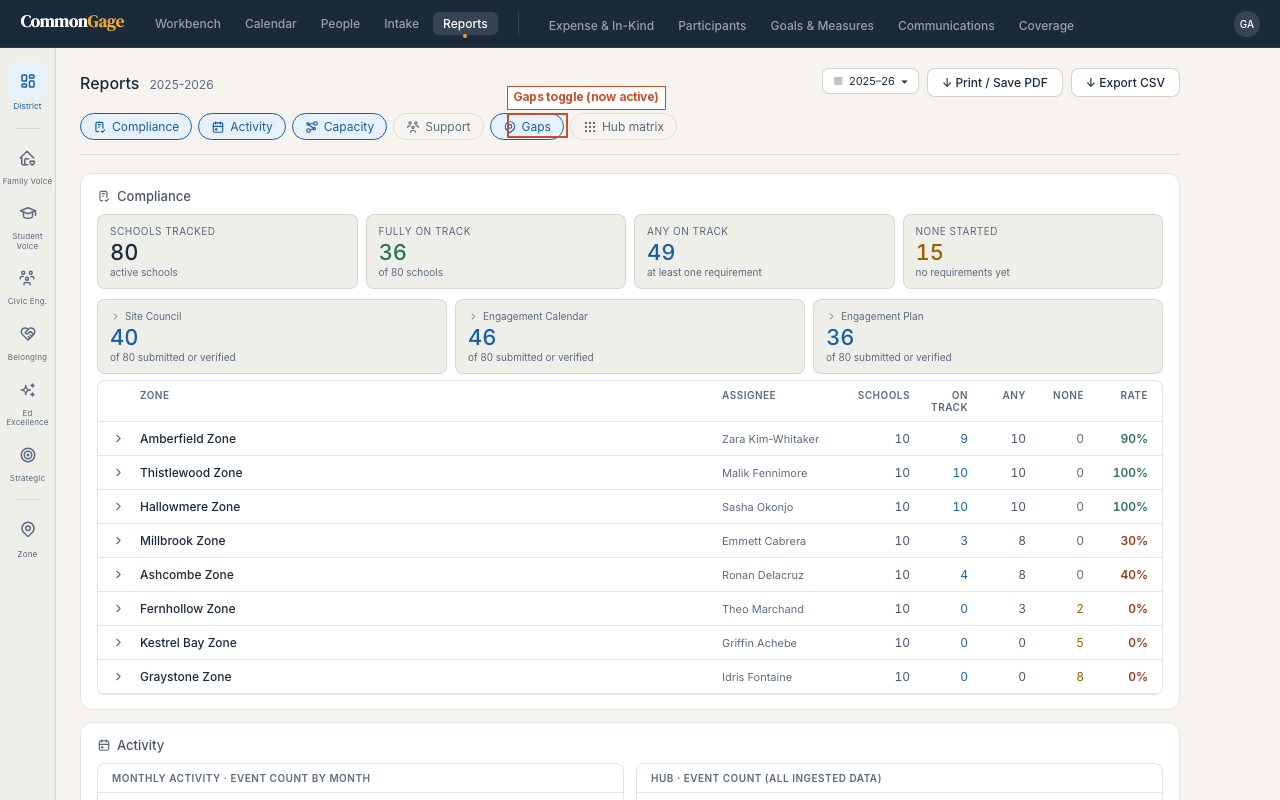
- Toggle on whichever chips you need. Compliance, Activity, and Capacity are on by default.
- Review, then click Print / Save PDF.
| Toggle | What appears |
|---|---|
| Compliance | Obligation stat cards, requirement counts, and a zone-by-zone table |
| Activity | Monthly event chart, hub distribution, and zone breakdown |
| Capacity | 4C summary, by-zone and by-hub cross-tabs, and batch AI classify (Org Admins only) |
| Support | Engagement Support records — languages, childcare, coordination hours |
| Gaps | Schools with zero events logged |
| Hub matrix | Hub × zone coverage grid |
Toggle chips on or off to build the view you need — your layout is remembered across sessions. Use the year switcher (top right) to flip between academic years; every view on this screen responds to whatever year is selected. Print / Save PDF prints only the blocks currently toggled on; District View also has a separate Export CSV button for a raw data export, respecting whatever period and filters are active.
Hub stories
- In the rail, click one of the hub icons.
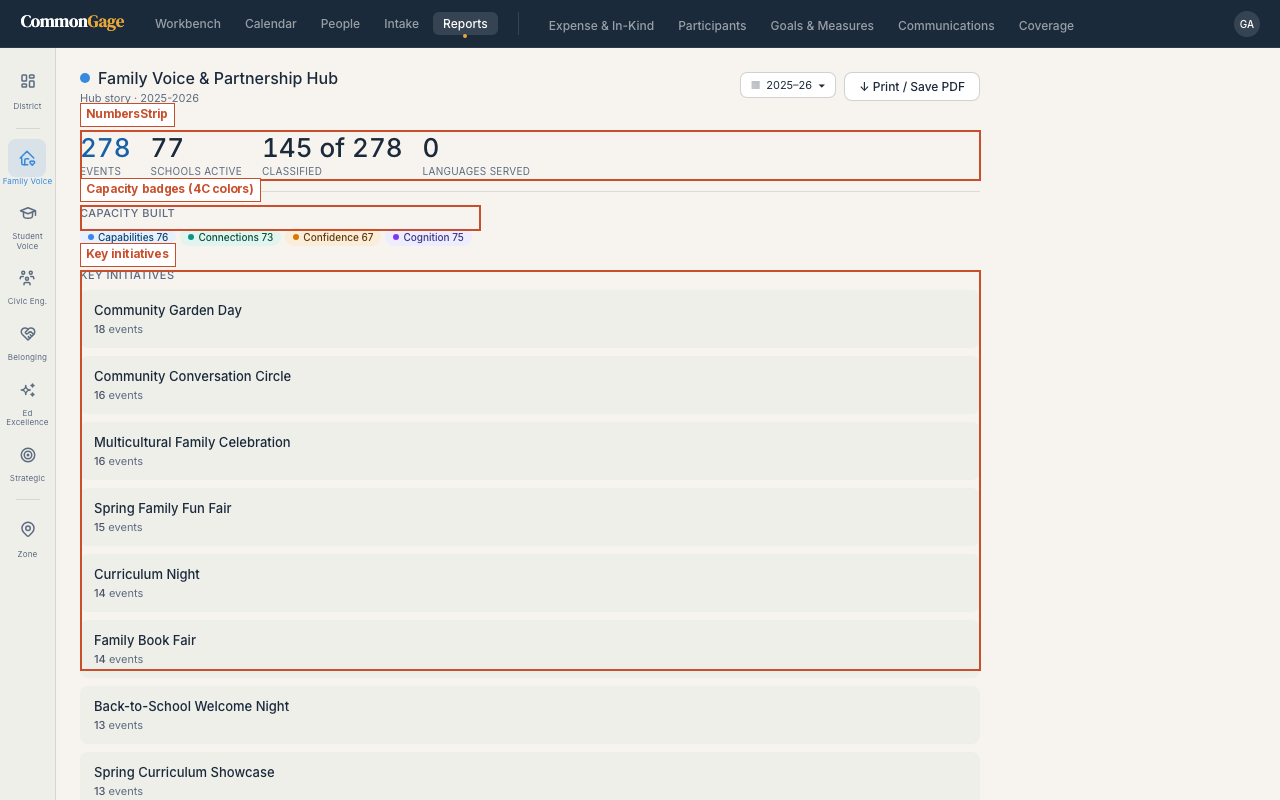
- Review its numbers strip (events, schools active, events classified, languages served), its capacity badges (the 4C's, aggregated), and its key initiatives — event clusters grouped by recurring title pattern (e.g. "The Village Table — 12 sessions").
- Click Print / Save PDF for a standalone chapter on that hub — the format matches an end-of-year report chapter.
Zone view
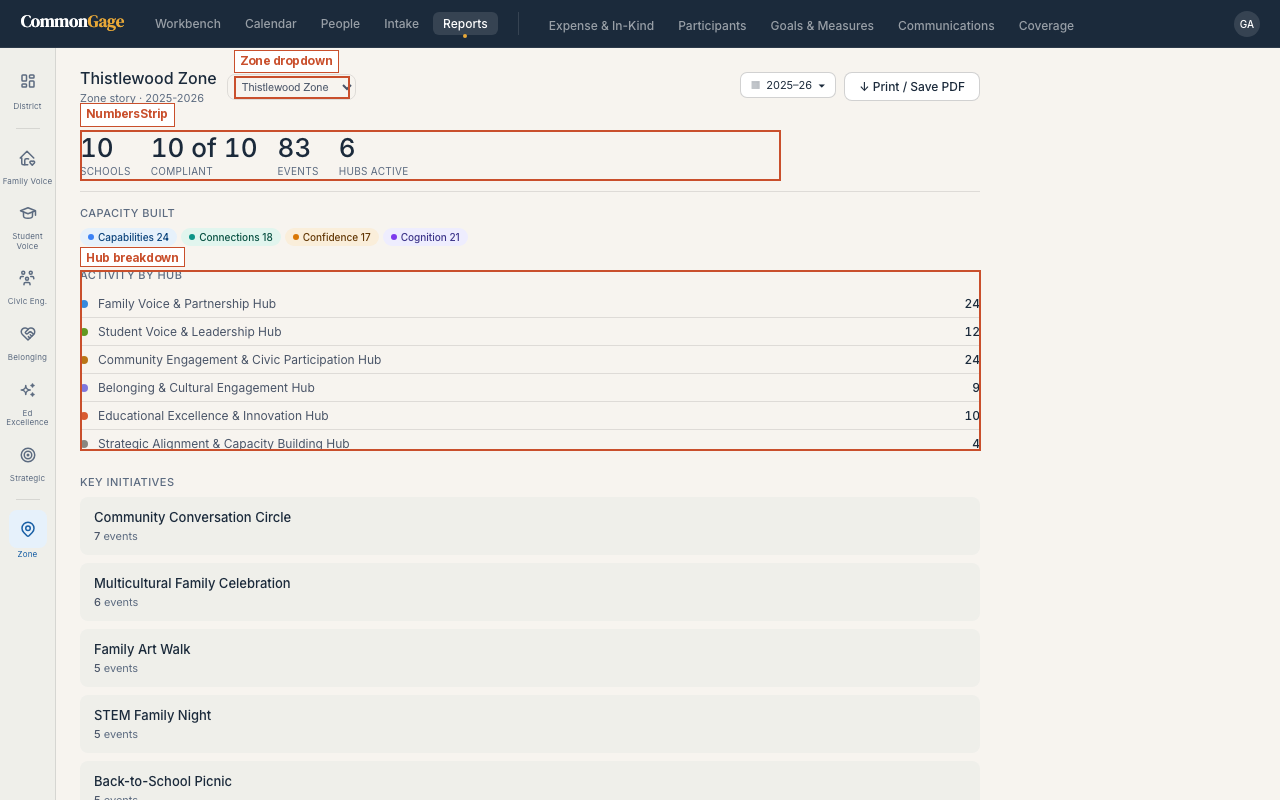
- In the rail, click the Zone icon (bottom of the rail), then choose a zone from the dropdown that appears.
- Review that zone's numbers strip (schools in zone, requirement completion rate, total events, hubs active), its capacity built, its activity by hub, its key initiatives, and any schools with no events — a gaps list scoped to that zone only — then print or save as above.
Every section of your end-of-year report maps to a surface in CommonGage. Hub-by-hub narratives come from hub stories. Compliance rates come from the District View. 4C capacity breakdowns come from the Capacity toggle. Engagement support data comes from the Support toggle. Zone-level activity comes from zone views. Cost data comes from Expense & In-Kind. The record is only as complete as the work you put in during the year — but if you've done it, the report is already written.